
Data Analysis: Carbon Monoxide

What our data means
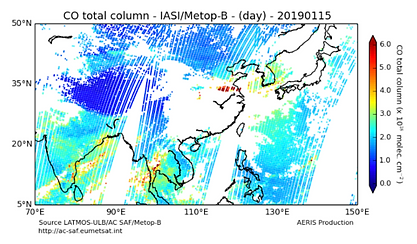
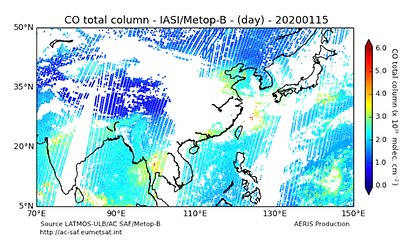
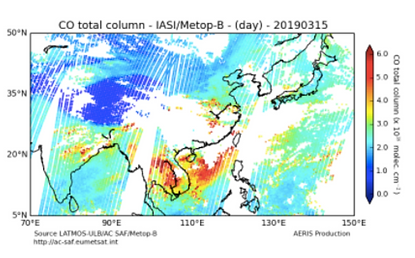
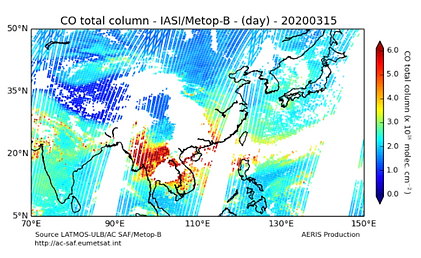
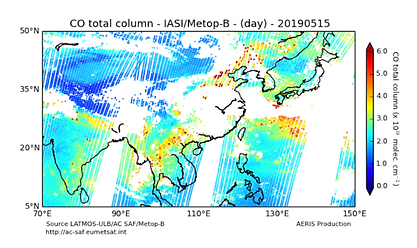
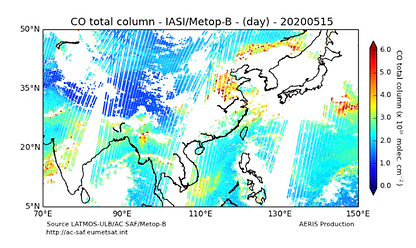
In our research, we have drawn a correlation between pollution in the troposphere and outbreaks of COVID-19. In the countries that experienced large outbreaks and were forced to quarantine, pollution logically decreased as fewer people were out driving cars, public transportation was widely reduced, and production of many products halted. But in order to quantitatively measure this decrease in pollution, we tracked CO levels in the atmosphere throughout the spring of 2020 and compared them to levels throughout the spring of 2019. The lifespan of CO in the atmosphere is only a few weeks, so tracking CO made it possible to measure changes throughout the relatively short time frame during which countries have been responding to the pandemic. We looked at pandemic hotspots around the globe, closely examining CO levels in Asia and North America. We observed decreases in CO levels in Asia and North America throughout the spring of 2020 when compared with the spring of 2019, indicating decreases in pollution correlating to stay at home orders throughout these regions of the world. This is especially significant considering upwards trends in CO levels each year, prior to 2020. The 2020 data reveals a complete reverse to this trend, suggesting that COVID forced quarantines have quickly had a significant impact on pollution levels.
2020
2019
Carbon Monoxide Levels
ASIA
January 15
March 15
May 15
North America
January 15


March 15


May 15

